
2024
Gregory-Portland Air Quality Report Card
Air quality remains excellent in comparison to other Texas cities
Data collected over five years of continuous monitoring at three locations in Portland and Gregory show air quality remains excellent in comparison to other Texas cities.
Gregory-Portland air quality ranks in the top 10% in Texas compared to data measured at the 40 similar TCEQ-operated or funded monitors across the state.
Download the full report card, English
Download the full report card, Spanish
Data included here is collected and interpreted by the University of Texas at Austin Center for Energy and Environmental Resources (CEER).
Gregory-Portland Air Quality Report Card for 2024
| Grading Period: Jan to Dec 2024 | Grade |
| Overall air quality | A |
| Individual contaminants | |
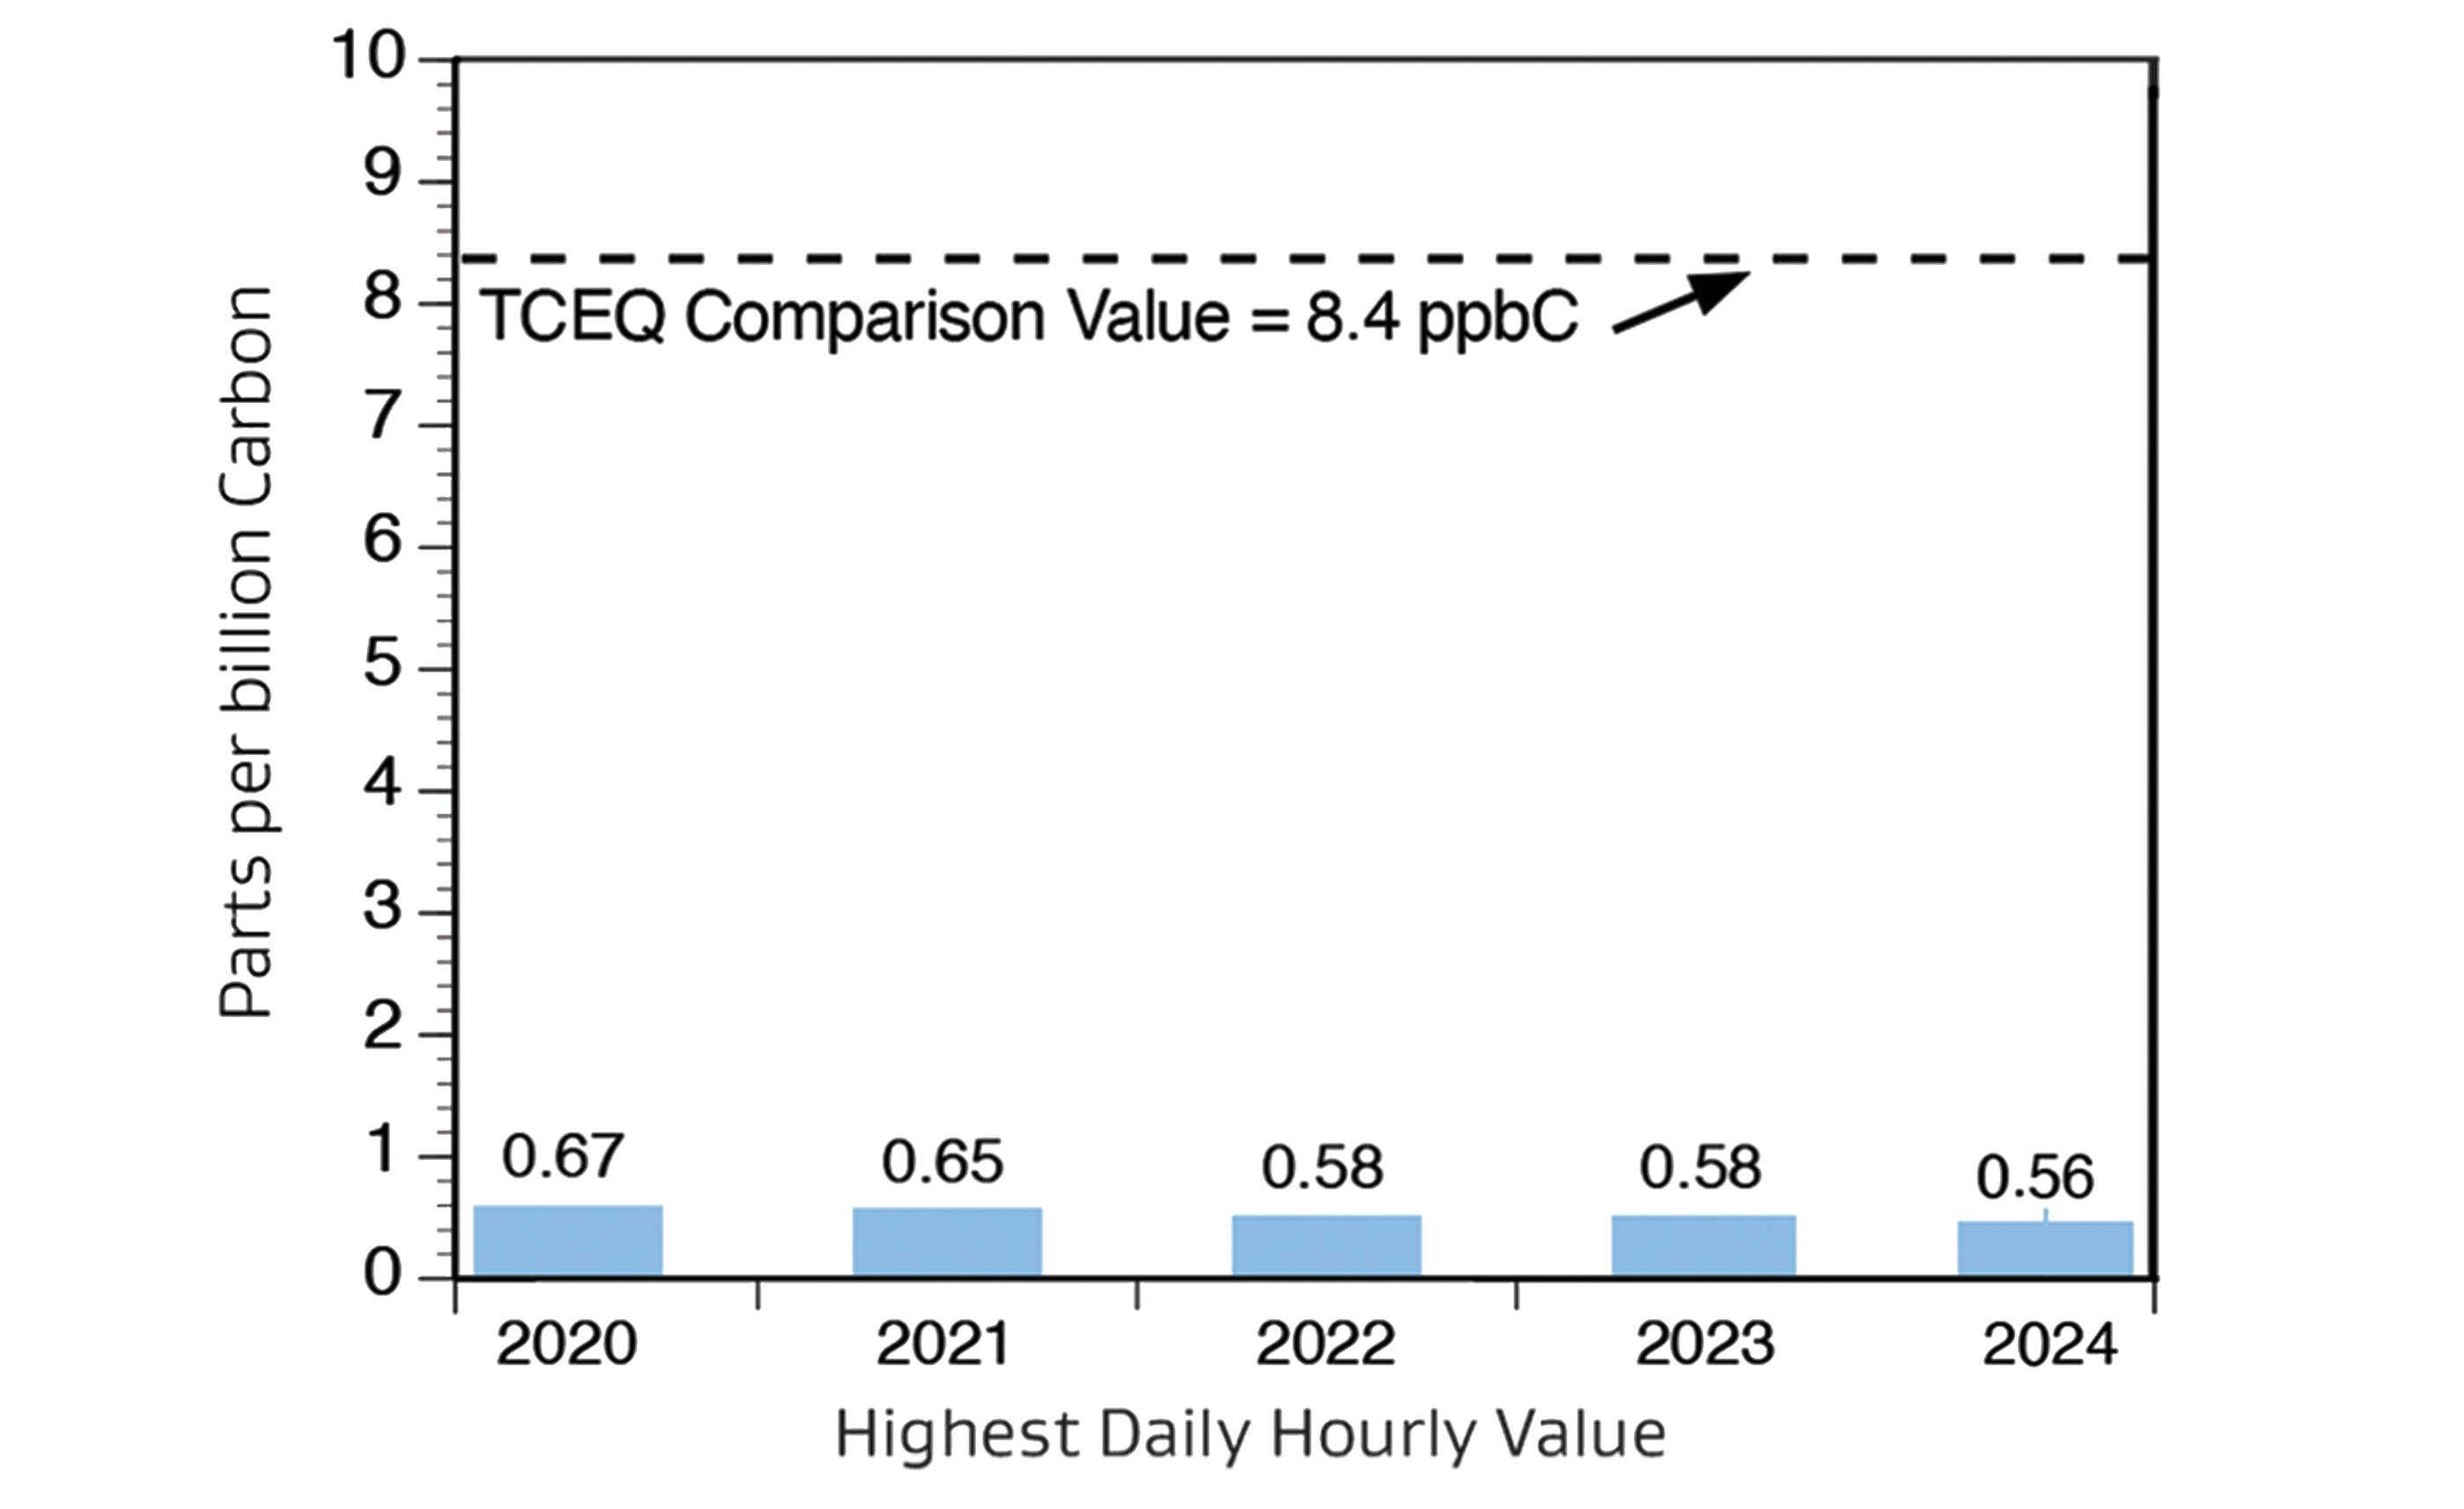
| Benzene | A |
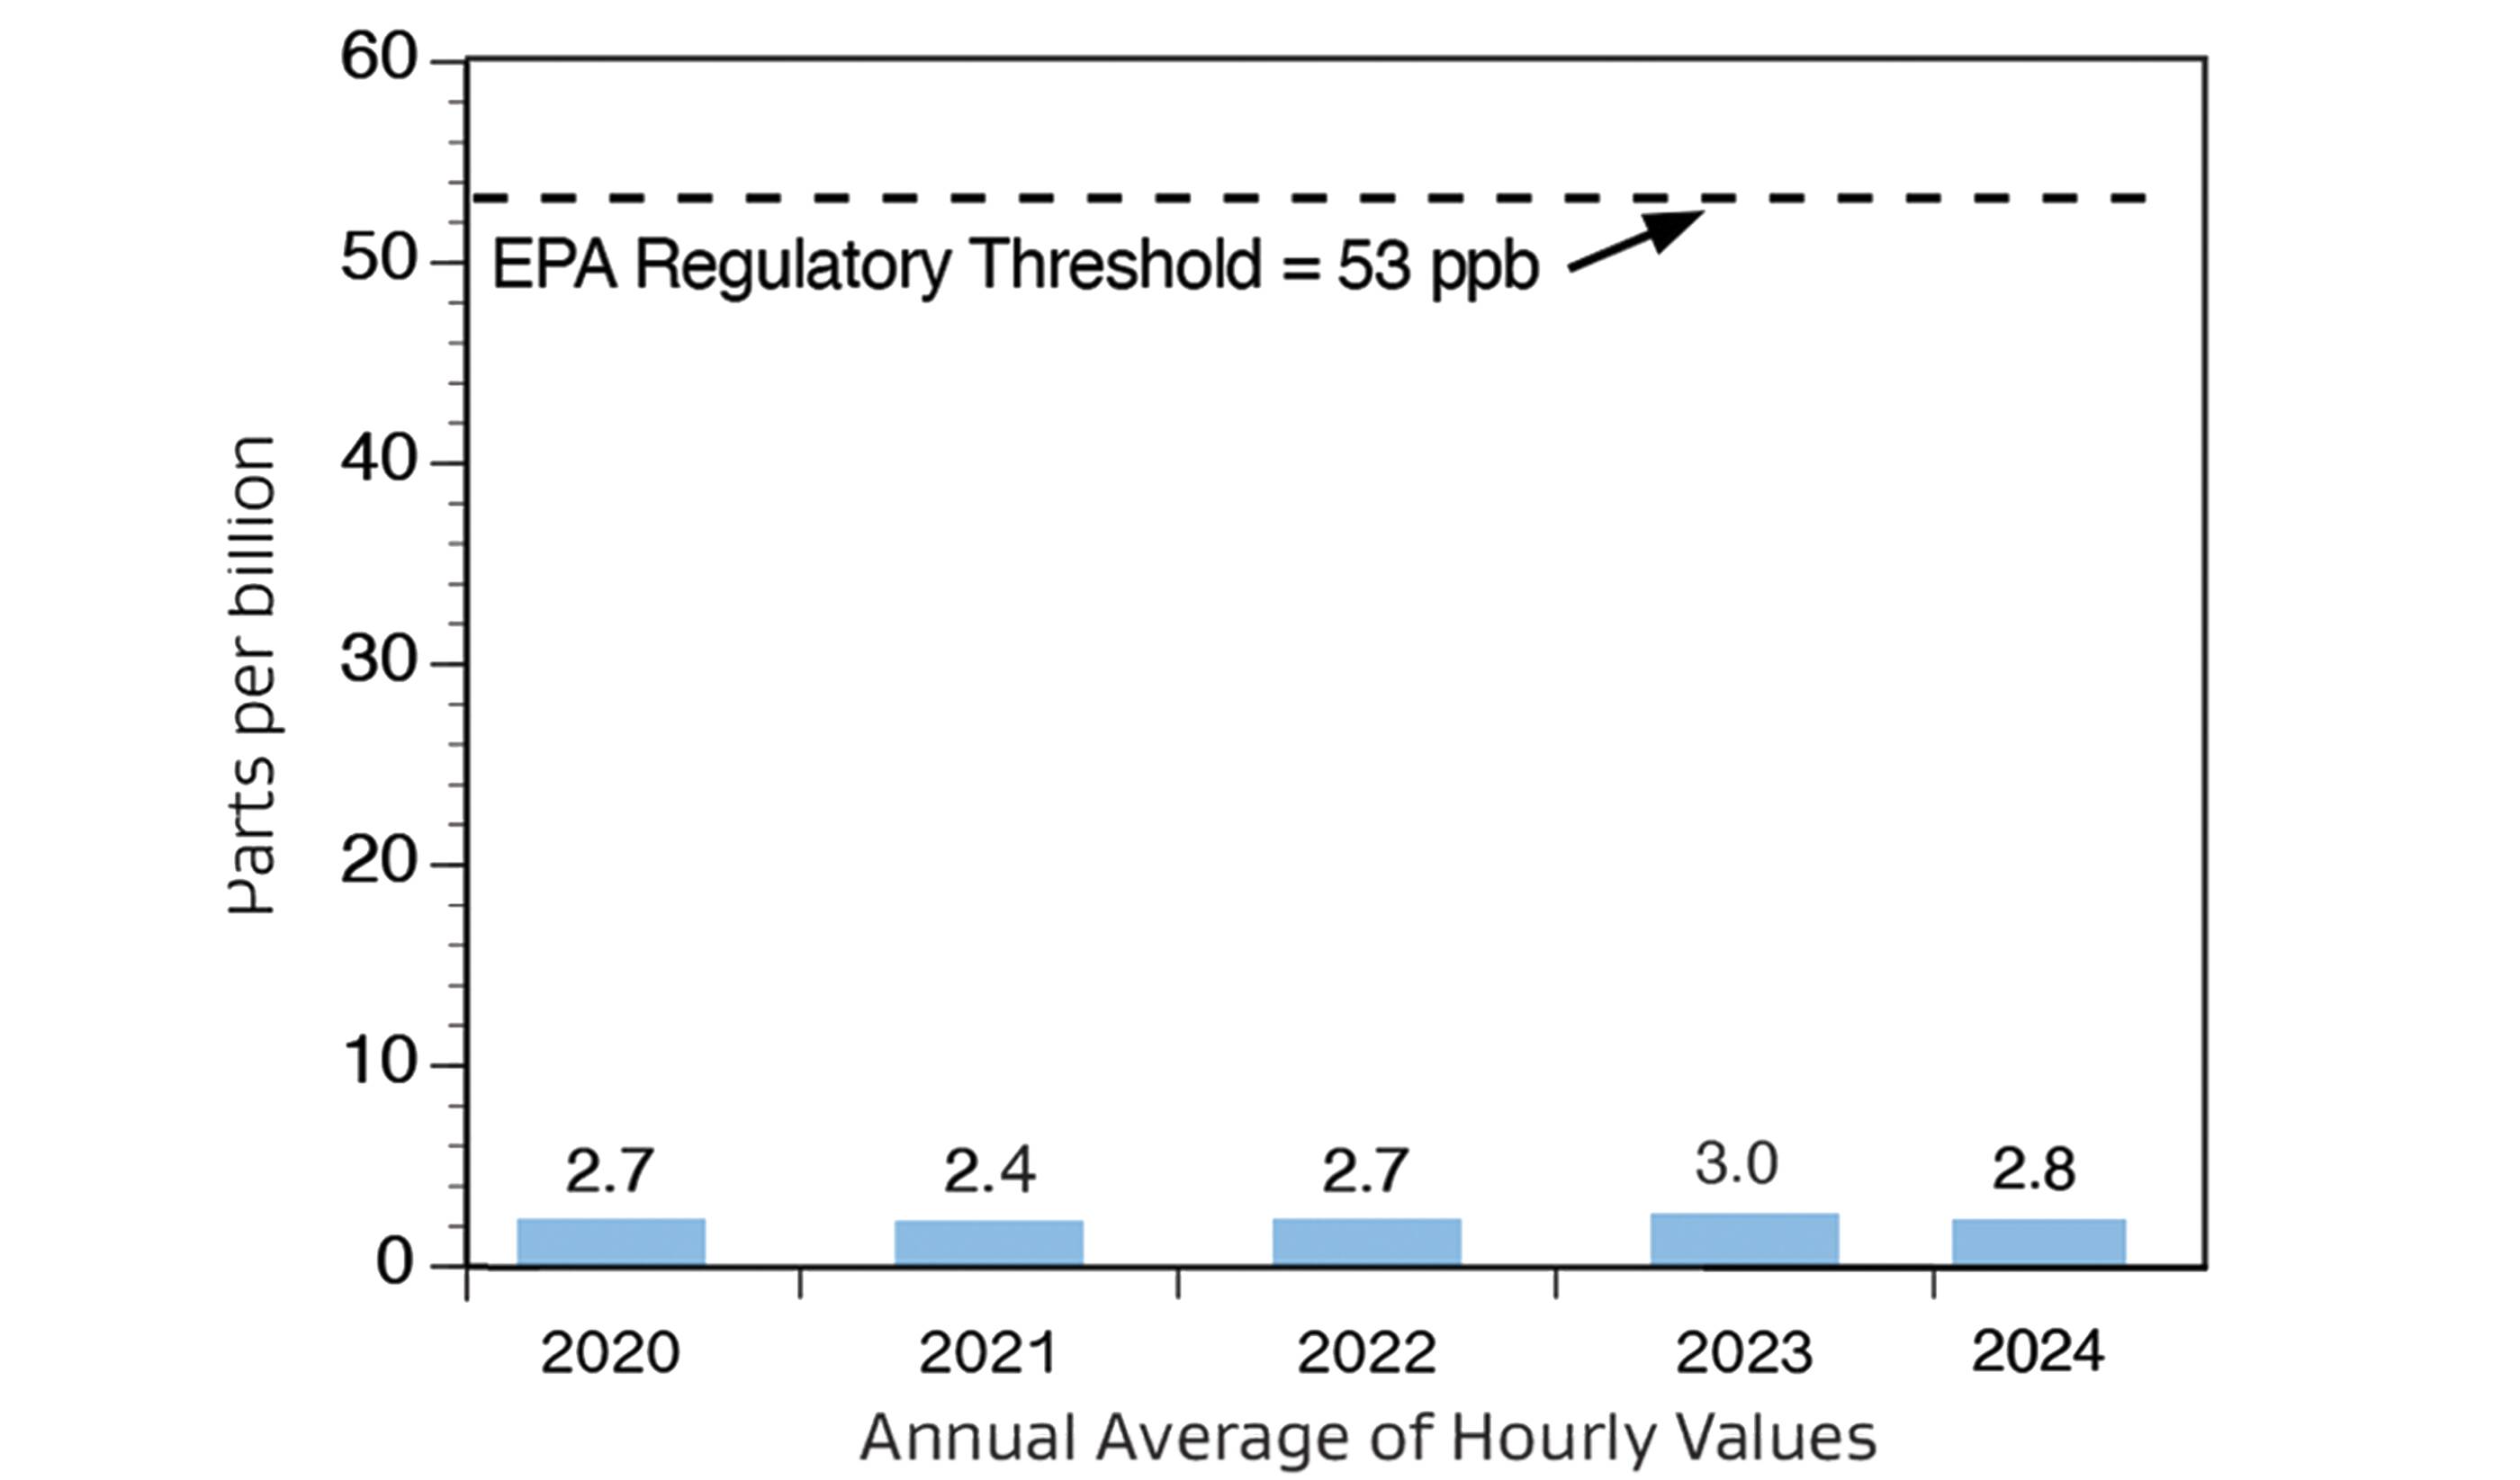
| Nitrogen Dioxide (NO2) | A |
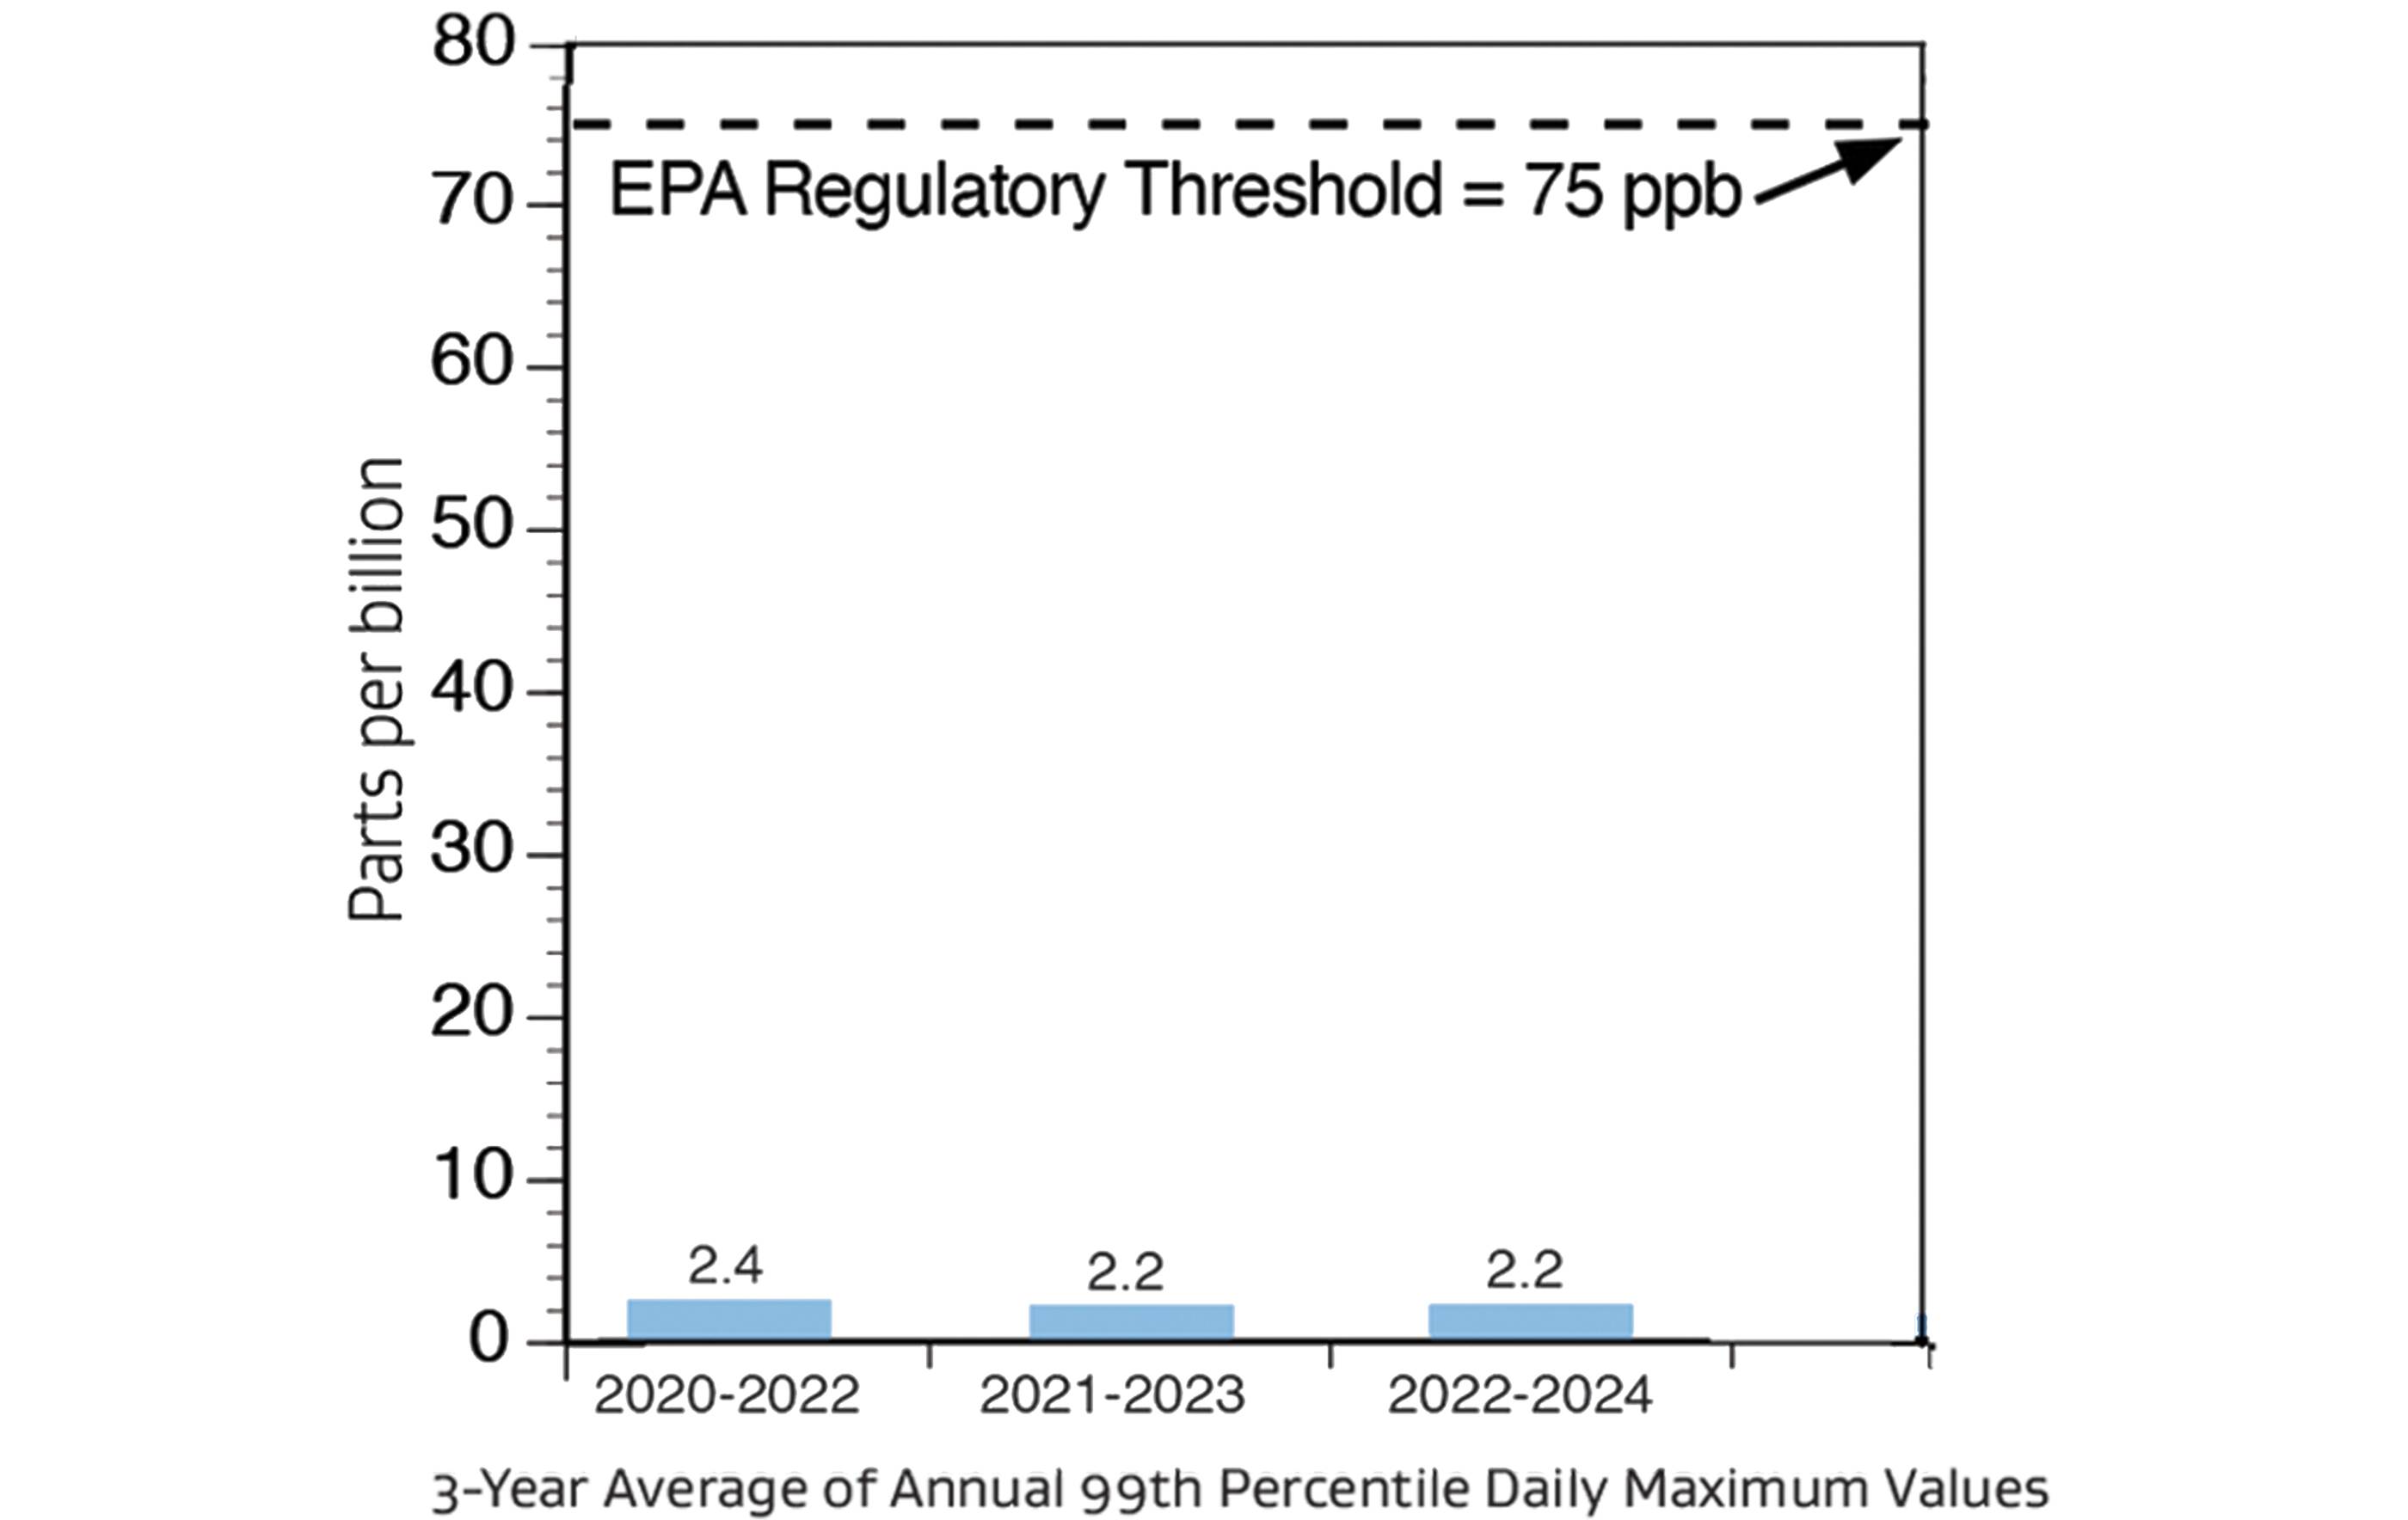
| Sulfur Dioxide (SO2) | A |
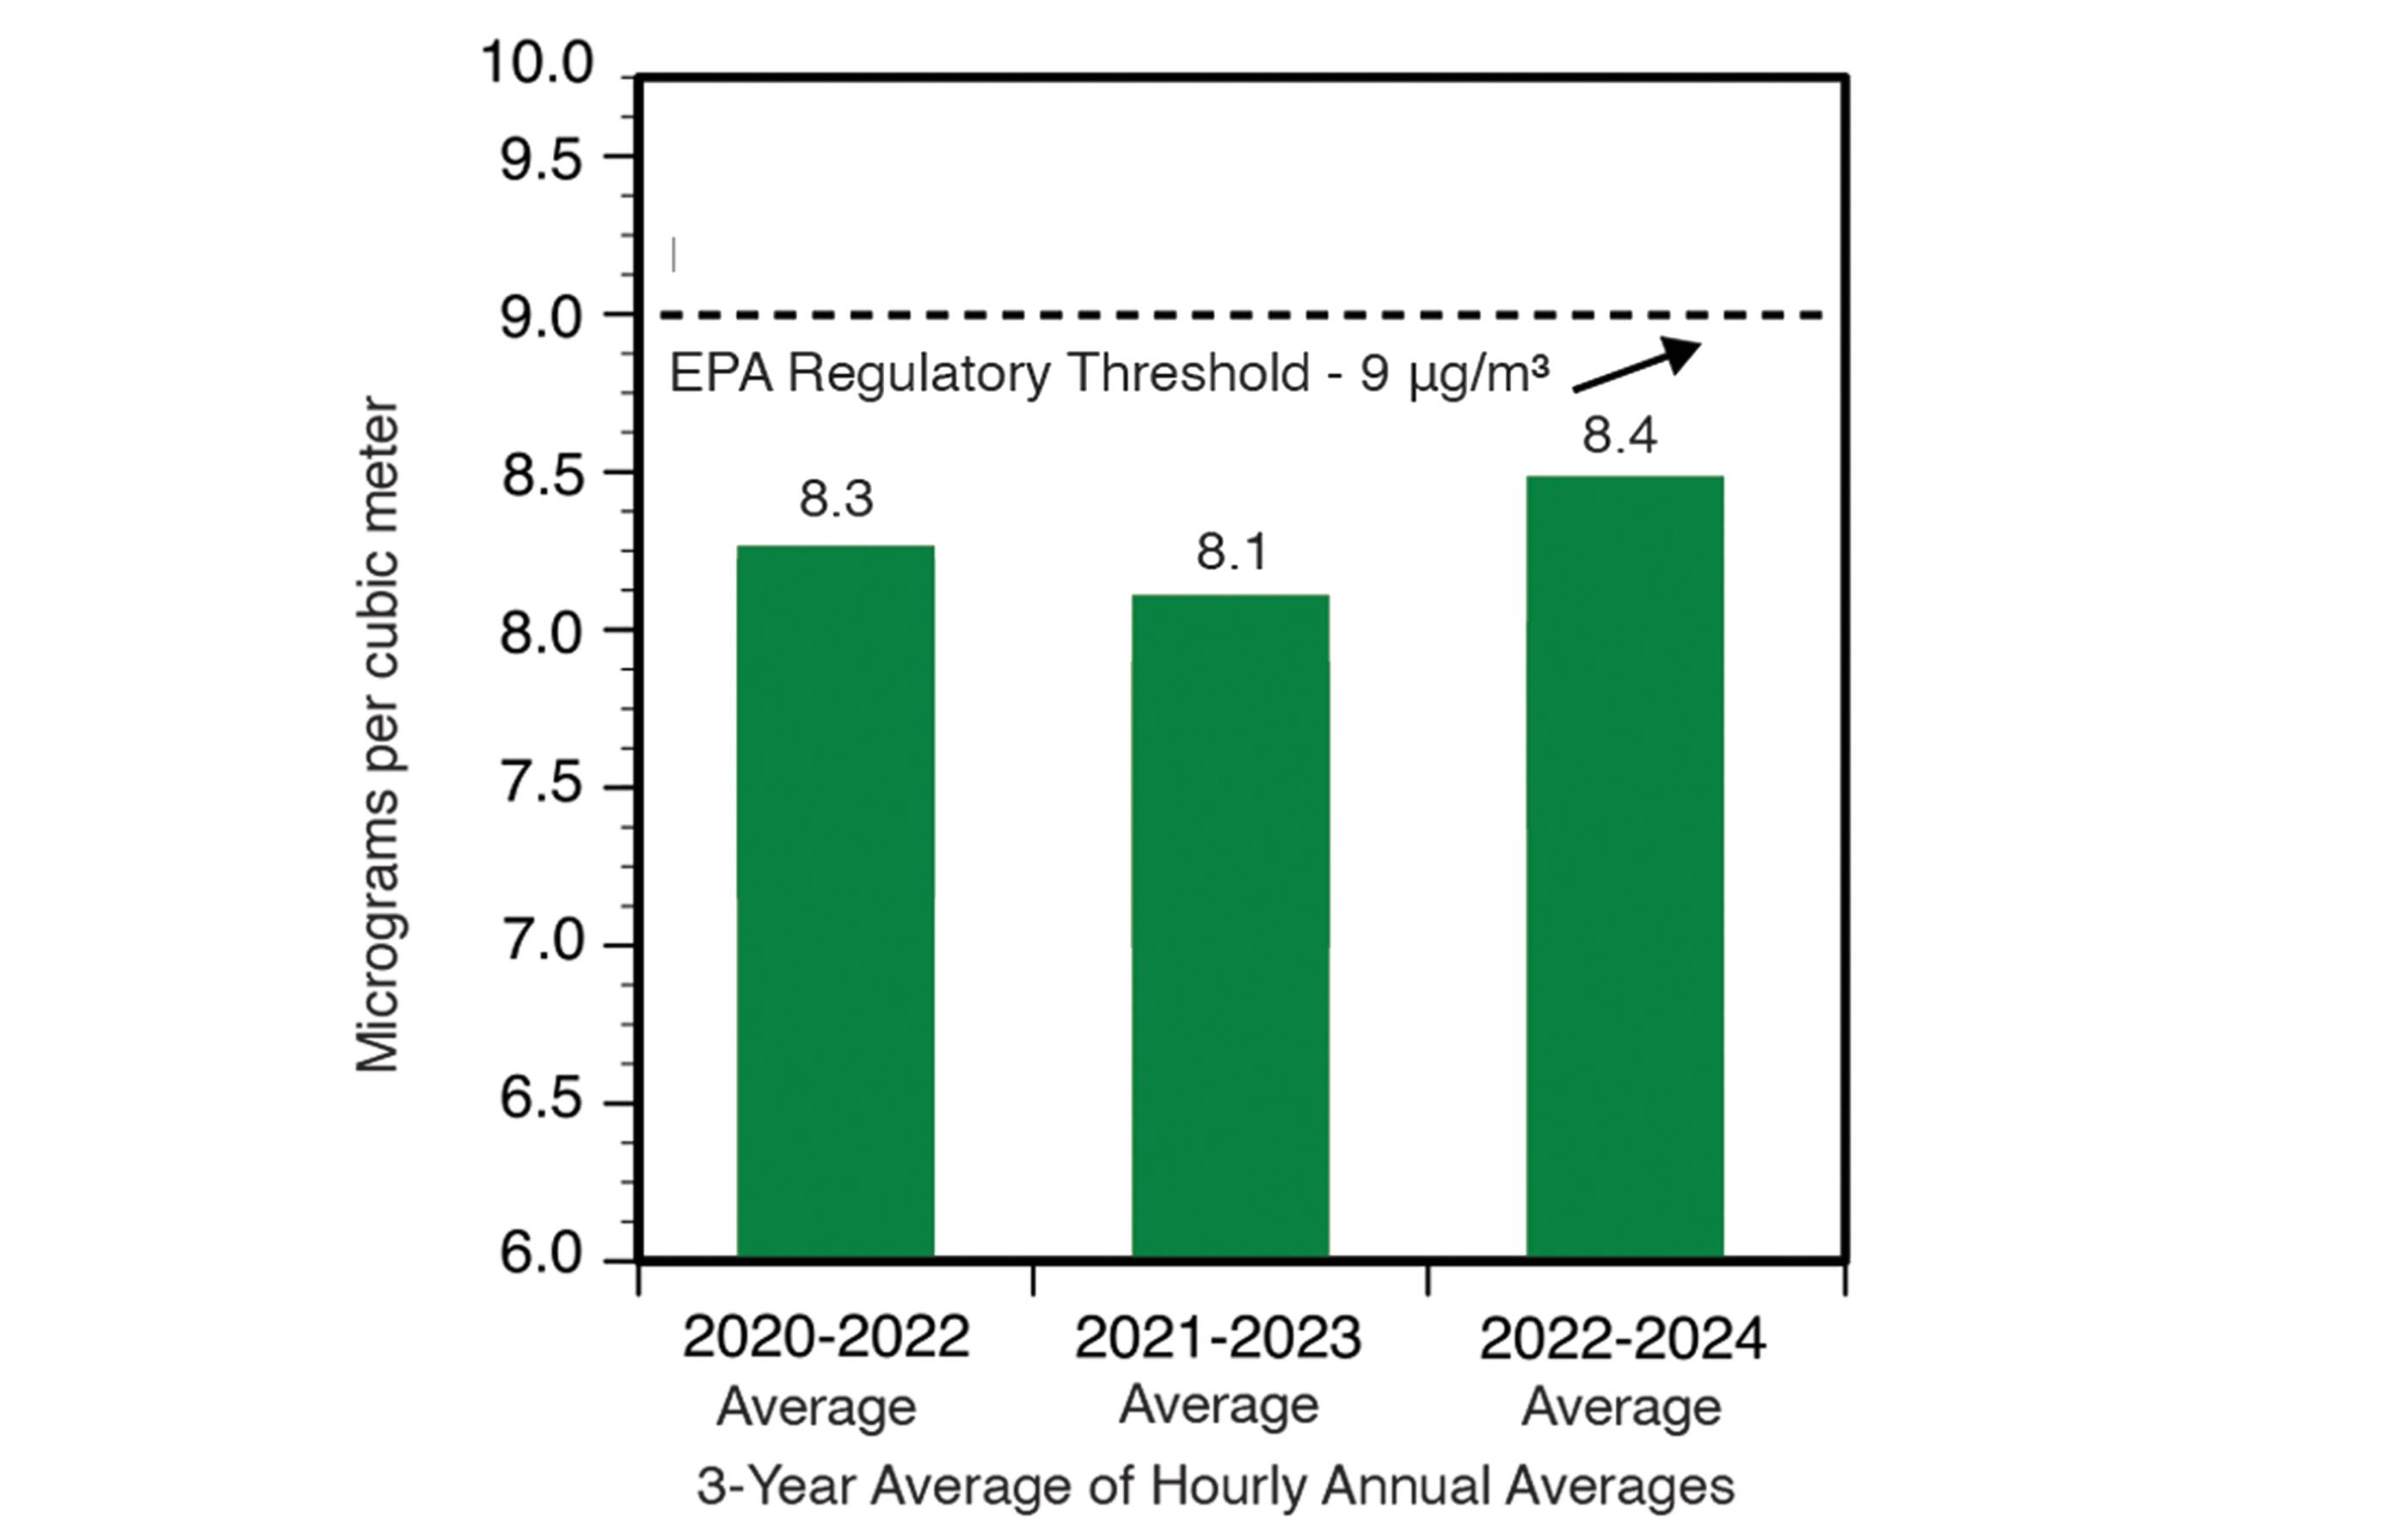
| Fine Particulate Matter (PM 2.5) | B |
Grading scale for 2024
| Grade | Description |
| A | Excellent |
| B |
Good |
| C | Moderate |
| D | Unhealthy for select groups |
| F | Unhealthy for all |

Gregory-Portland Air Monitoring Stations
Continuous, 24/7 air quality monitoring in the community
The G-P Air Monitoring Program stations monitor the air for changes in concentrations of compounds typically found in urban and industrial areas.
UT Austin experts compare collected data with the following sets of metrics used by the Texas Commission on Environmental Quality (TCEQ) to assess the air quality in Texas. Both regulatory metrics are shown in the charts to the right as reference points for the actual data reported.
Nitrogen Dioxide (NO2)
Fine Particulate Matter (PM 2.5)
Benzene
Sulfur Dioxide (SO2)

The Coastal Bend Air Quality Partnership has many suggestions on how each of us can make small changes in our everyday activities to help local air quality
About the Gregory-Portland Air Monitoring Program
-
Independent, unbiased data collection and analysis by The University of Texas at Austin
Learn more about the multi-year data- Objective: To measure the ambient (outdoor) air quality and keep the community informed of the air quality status as development continues to occur over time
- Funded entirely by Cheniere Energy and Gulf Coast Growth Ventures for the benefit of the community
- Air monitoring measurements conducted, analyzed and reported by UT Austin
- Data obtained using U.S. Environmental Protection Agency (EPA) federal reference or equivalent methods and instrumental approved for air monitoring
-
Periodic, public reporting
Learn more about the multi-year data- Data are reported on a publicly available website (see links below) managed by UT Austin Center for Energy and Environmental Resources
- Summary of data is also presented annually in this report card for your convenience